반응형
Notice
Recent Posts
Recent Comments
Link
| 일 | 월 | 화 | 수 | 목 | 금 | 토 |
|---|---|---|---|---|---|---|
| 1 | ||||||
| 2 | 3 | 4 | 5 | 6 | 7 | 8 |
| 9 | 10 | 11 | 12 | 13 | 14 | 15 |
| 16 | 17 | 18 | 19 | 20 | 21 | 22 |
| 23 | 24 | 25 | 26 | 27 | 28 | 29 |
| 30 |
Tags
- pandas
- React
- 강화학습
- GYM
- expo
- 클론코딩
- 머신러닝
- 조코딩
- clone coding
- 강화학습 기초
- Instagrame clone
- Ros
- 딥러닝
- redux
- TeachagleMachine
- coding
- 앱개발
- 카트폴
- JavaScript
- 데이터분석
- 리액트네이티브
- 전국국밥
- ReactNative
- 사이드프로젝트
- Reinforcement Learning
- python
- App
- FirebaseV9
- kaggle
- selenium
Archives
- Today
- Total
qcoding
[데이터분석실습] 미국 동북중부_midwest 정보 확인 (np.where / value_counts / sort_index) 본문
Python 데이터분석
[데이터분석실습] 미국 동북중부_midwest 정보 확인 (np.where / value_counts / sort_index)
Qcoding 2022. 6. 19. 17:32반응형
## 미국 동북중부 데이터를 가지고 데이터 분석 실습 진행하기
https://github.com/youngwoos/Doit_Python
GitHub - youngwoos/Doit_Python: <Do it! 쉽게 배우는 파이썬 데이터 분석> 저장소
<Do it! 쉽게 배우는 파이썬 데이터 분석> 저장소. Contribute to youngwoos/Doit_Python development by creating an account on GitHub.
github.com
1) 데이터의 특징 파악 ( Data는 위에 자료 활용)
import pandas as pd
import numpy as np

df=pd.read_csv('./midwest.csv')
df
데이터는 총 437개의 행과 28개의 열을 가지고 있으므로, 28개의 변수가 포함되어 있는 것을 확인할 수 있다.

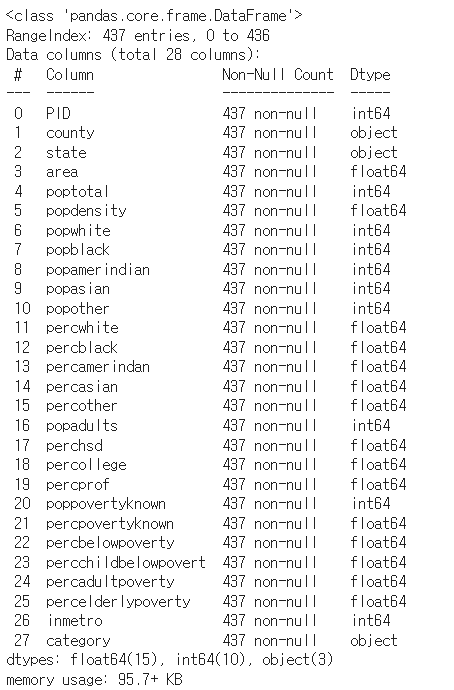
변수의 속성을 확인하기 위해서 info()정보를 확인한다.
df.info()총 28개의 정보 중에서 non-null 이 전부 다 인것을 봐서는 결측치가 존재하지 않는 것을 알수있다.

요약 통계량을 확인해 본다.
df.describe()
2) poptotal (전체 인구) 변수를 total로, popasian(아시아 인구) 변수를 asian으로 수정하세요.
## rename 사용해서 변수 수정하기
df=df.rename(columns={'poptotal':'total', 'popasian':'asian'})
df
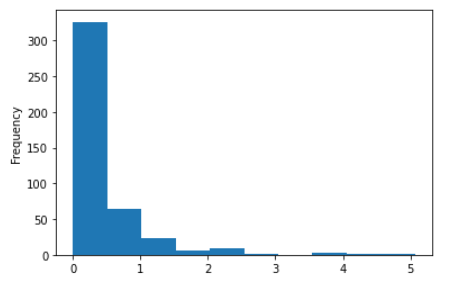
3) total, asian변수를 사용하여 '전체 인구 대비 아시아 인구 백분율 ' 파생변수를 추가하고, 히스토그램을 만들어 분포를 살펴보세요.
# 파생변수 추가
df['asian_per_total']=(df['asian']/df['total'])*100
df['asian_per_total']

# 히스토그램
df['asian_per_total'].plot
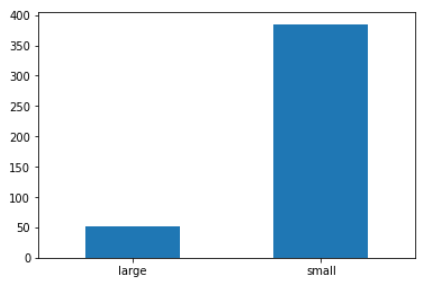
3) 아시아 인구 백분율 전체 평균을 구하고, 평균을 초과하면 'large', 그 외에는 'small' 을 부여한 파샌변수를 만들어 보세요. 그리고 빈도표와 빈도 막대 그개프를 만들어 보세요.
# np.where 사용하여 조건 파생변수 만들기
asian_mean=df['asian'].mean()
df['asian_category']=np.where(df['asian']>asian_mean,'large','small')

# value_counts().sort_index() 활용
asian_category=df['asian_category'].value_counts().sort_index()
# bar 그래프 그리고, 축 rotaion=0 로 만들기
asian_category.plot.bar(rot=0)
### 추가 정보
# np where 조건 이 여러개 일 때로 아래와 같이 사용할 때

mpg['size']=np.where( (mpg['category'] == 'campact') |
                      (mpg['category'] == 'subcompact')
                    ,'small','large')


# isin()을 사용하여 아래와 같이 코드를 변경할 수 있음.

mpg['size']=np.where( mpg['category'].isin(['compact','subcompact']) , 'small' , 'large' )
반응형
'Python 데이터분석' 카테고리의 다른 글
| [데이터분석실습]텍스트 마이닝_대통령 연설문 분석 (0) | 2022.06.26 |
|---|---|
| [데이터분석정리_2] 그래프 그리기 (0) | 2022.06.24 |
| [데이터분석_정리_1]query() / sort_values() / assign() / groupby() / agg() / merge() / concat() (0) | 2022.06.21 |
| [데이터분석실습]mpg 데이터를 통한 분석 (query 사용법 / query 변수 / query in) (0) | 2022.06.19 |
| [seaborn] titanic 그래프 그리기 && pydataset 활용 (0) | 2022.06.19 |
Comments


