| 일 | 월 | 화 | 수 | 목 | 금 | 토 |
|---|---|---|---|---|---|---|
| 1 | 2 | 3 | 4 | 5 | 6 | |
| 7 | 8 | 9 | 10 | 11 | 12 | 13 |
| 14 | 15 | 16 | 17 | 18 | 19 | 20 |
| 21 | 22 | 23 | 24 | 25 | 26 | 27 |
| 28 | 29 | 30 | 31 |
- App
- redux
- kaggle
- Reinforcement Learning
- 강화학습 기초
- 조코딩
- 앱개발
- selenium
- 전국국밥
- 강화학습
- 클론코딩
- expo
- FirebaseV9
- Instagrame clone
- 데이터분석
- JavaScript
- GYM
- 딥러닝
- 카트폴
- 머신러닝
- pandas
- 리액트네이티브
- 사이드프로젝트
- clone coding
- ReactNative
- React
- python
- TeachagleMachine
- Ros
- coding
- Today
- Total
qcoding
[데이터분석실습]텍스트 마이닝_대통령 연설문 분석 본문
https://github.com/youngwoos/Doit_Python/tree/main/Data
GitHub - youngwoos/Doit_Python: <Do it! 쉽게 배우는 파이썬 데이터 분석> 저장소
<Do it! 쉽게 배우는 파이썬 데이터 분석> 저장소. Contribute to youngwoos/Doit_Python development by creating an account on GitHub.
github.com
## 대통령 연설문을 통해서 텍스트 마이닝 분석
1) 패키지 설치
!pip install jpype1
!pip install konlpy
2) 데이터 불러오기
df=open('speech_moon.txt',encoding='UTF-8').read()
df
3) 불필요한 문자 제거하기
--> [^가-힣]
은 '한글이 아닌 모든문자' 를 의미하는 정규 표현식입니다.
# 불필요한 문자 제거하기
import re
df=re.sub('[^가-힣]',"",df)
df
4) 명사 추출하기
# 명사추출하기
import konlpy
hannanum=konlpy.tag.Hannanum()

hannanum.nouns("대한민국의 영토는 한반도와 그 부속도서를 한다")

# 연설문에서 명사 추출하기
nouns=hannanum.nouns(df)
nouns

## list 현태가 되므로 data 프레임으로 변환
import pandas as pd
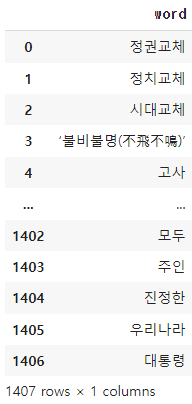
df_word=pd.DataFrame({'word':nouns})
df_word
4) 단어 빈도표 만들기
# 단어 빈도표 만들기 - 두글자 이상만 남기기
df_word['count']=df_word['word'].str.len()
df_word
## 두 글자 이상만 남기기
df_word=df_word.query('count>=2')
df_word.sort_values('count')
## 단어의 사용 빈도를 구하고 빈도수로 정렬하기
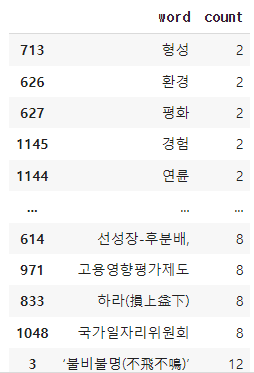
df_word=df_word.groupby('word',as_index=False).agg( count=('word','count') ).sort_values('count',ascending=False)
df_word
5) 단어 빈도 막대 그래프 만들기
# 단어 빈도 상위 20개 추출.
top20=df_word.head(20)
top20
## colab 에서 font 설치하기
## 설치후 런타임 재시작 후진행
!sudo apt-get install -y fonts-nanum
!sudo fc-cache -fv
!rm ~/.cache/matplotlib -rf
##그래프 그리기
import seaborn as sns
import matplotlib.pyplot as plt
import matplotlib
matplotlib.font_manager._rebuild()
plt.rcParams.update({
'font.family' :'NanumBarunGothic',
'figure.dpi' : '120',
'figure.figsize' : [6.5,6]
})
##막대그래프 만들기
sns.barplot(data=top20, x='count', y='word');
6) word cloud 만들기
## 패키지 설치
# pip install wordcloud
!pip install wordcloud
dataFrame을 dictinary 형태로 변환
# 데이터 프레임을 딕셔너리로 변환
dic_word=df_word.set_index('word').to_dict()['count']
dic_word
* 주의 font ttf 파일을 working 디렉토리로 업로드 해주어야함.
# word cloud 만들기
from wordcloud import WordCloud

wc=WordCloud(
      random_state=1234,
      font_path='DoHyeon-Regular.ttf',
      width=400,
      height=400,
      background_color='white'
)

img_wordcloud=wc.generate_from_frequencies(dic_word)

plt.figure(figsize=(5,5))
plt.axis('off')
plt.imshow(img_wordcloud)
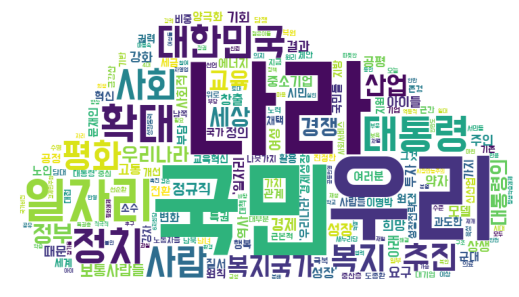
7) word cloud 모양 바꾸기
## 워드 클라우드 모양 바꾸기
import PIL
icon=PIL.Image.open('./cloud.png')

# 불러온 이미지 파일 -> mask를 만듦
import numpy as np
img=PIL.Image.new('RGB',icon.size,(255,255,255))
img.paste(icon,icon)
img=np.array(img)

# mask를 활용하도록 설정
from wordcloud import WordCloud

wc=WordCloud(
      random_state=1234,
      font_path='DoHyeon-Regular.ttf',
      width=400,
      height=400,
      background_color='white',
      mask=img
)

## word cloud 만들기
img_wordcloud=wc.generate_from_frequencies(dic_word)

# word cloud 출력
plt.figure(figsize=(10,10))
plt.axis('off')
plt.imshow(img_wordcloud)
8) 워드 클라우드 색깔 바꾸기
--> colormap 에 inferno 변경 , colormap 아래와 같이 다양하게 적용가늫암
https://matplotlib.org/stable/tutorials/colors/colormaps.html
Choosing Colormaps in Matplotlib — Matplotlib 3.5.2 documentation
Colormaps are often split into several categories based on their function (see, e.g., [Moreland]): First, we'll show the range of each colormap. Note that some seem to change more "quickly" than others. Sequential2 Many of the \(L^*\) values from the Seque
matplotlib.org
## 색깔 바꾸기
wc=WordCloud(
      random_state=1234,
      font_path='DoHyeon-Regular.ttf',
      width=400,
      height=400,
      background_color='white',
      mask=img,
      colormap='inferno'
)
'Python 데이터분석' 카테고리의 다른 글
| [데이터분석실습]지도 시각화 (0) | 2022.06.28 |
|---|---|
| [데이터분석실습]기사 댓글 텍스트 마이닝 (0) | 2022.06.27 |
| [데이터분석정리_2] 그래프 그리기 (0) | 2022.06.24 |
| [데이터분석_정리_1]query() / sort_values() / assign() / groupby() / agg() / merge() / concat() (0) | 2022.06.21 |
| [데이터분석실습]mpg 데이터를 통한 분석 (query 사용법 / query 변수 / query in) (0) | 2022.06.19 |


