| 일 | 월 | 화 | 수 | 목 | 금 | 토 |
|---|---|---|---|---|---|---|
| 1 | ||||||
| 2 | 3 | 4 | 5 | 6 | 7 | 8 |
| 9 | 10 | 11 | 12 | 13 | 14 | 15 |
| 16 | 17 | 18 | 19 | 20 | 21 | 22 |
| 23 | 24 | 25 | 26 | 27 | 28 | 29 |
| 30 |
- 딥러닝
- 전국국밥
- 조코딩
- Reinforcement Learning
- 리액트네이티브
- ReactNative
- 머신러닝
- JavaScript
- Ros
- 데이터분석
- App
- coding
- 강화학습 기초
- expo
- 클론코딩
- 사이드프로젝트
- TeachagleMachine
- React
- python
- selenium
- 강화학습
- FirebaseV9
- GYM
- Instagrame clone
- clone coding
- kaggle
- redux
- pandas
- 앱개발
- 카트폴
- Today
- Total
qcoding
[데이터분석실습][다중분류_LR/XGB]공부 잘하는 것과 연관 된 연구 본문
## Kaggle
https://www.kaggle.com/datasets/aljarah/xAPI-Edu-Data
Students' Academic Performance Dataset
xAPI-Educational Mining Dataset
www.kaggle.com
### 각 columns에 대한 정보
gender: 학생의 성별 (M: 남성, F: 여성)
NationaliTy: 학생의 국적
PlaceofBirth: 학생이 태어난 국가
StageID: 학생이 다니는 학교 (초,중,고)
GradeID: 학생이 속한 성적 등급
SectionID: 학생이 속한 반 이름
Topic: 수강한 과목
Semester: 수강한 학기 (1학기/2학기)
Relation: 주 보호자와 학생의 관계
raisedhands: 학생이 수업 중 손을 든 횟수
VisITedResources: 학생이 과목 공지를 확인한 횟수
Discussion: 학생이 토론 그룹에 참여한 횟수
ParentAnsweringSurvey: 부모가 학교 설문에 참여했는지 여부
ParentschoolSatisfaction: 부모가 학교에 만족했는지 여부
StudentAbscenceDays: 학생의 결석 횟수 (7회 이상/미만)
Class: 학생의 성적 등급 (L: 낮음, M: 보통, H: 높음)
## 데이터 준비
import pandas as pd
import numpy as np
import matplotlib.pyplot as plt
import seaborn as sns
import matplotlib as mpl

df = pd.read_csv('./xAPI-Edu-Data.csv')
df.info()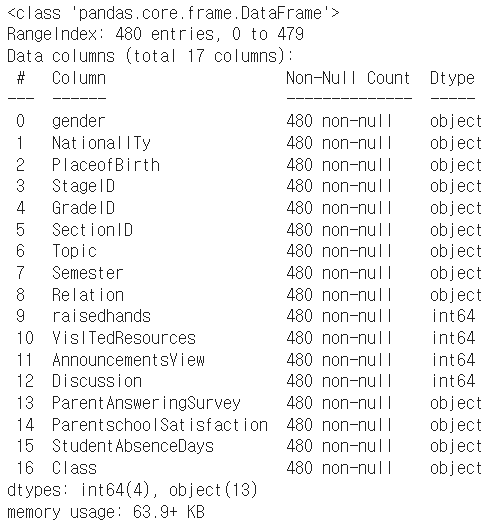
df.describe(include='all')describe를 하면 숫자형에 대한 통계만 나오게 되지만, include='all' 을 하면 문자형도 같이 보이게 된다. 그러나 평균/ 중앙값 등 계산이 불가능 한 값은 Nan으로 나옴.

## 데이터 시각화
1) 수치형 데이터 파악하기 ( hist plot )
mpl.rc('font',size=15)
mpl.rc('xtick',labelsize =12)

# seaborn의 histplot, jointplot, pairplot을 이용해 히스토그램 그리기
fig , axes = plt.subplots(nrows=3, ncols=2)
# plt.tight_layout()
fig.set_size_inches(20,15)
plt.subplots_adjust(hspace=0.7)

## raisedhands
axes[0,0] = sns.histplot(x='raisedhands' , data=df, multiple='dodge',hue='Class', ax=axes[0,0], bins=25, kde=True, hue_order=['L','M','H'])
axes[0,0].set(
    title='raisedhands'
)

## VisITedResources
axes[0,1]=sns.histplot(x='VisITedResources' , data=df, multiple='dodge',hue='Class', ax=axes[0,1],bins=25, kde=True, hue_order=['L','M','H'])
axes[0,1].set(
    title='VisITedResources'
)

## StudentAbsenceDays
axes[1,0]=sns.boxplot(x='gender',y='Discussion',data=df ,ax=axes[1,0], hue='Class', hue_order=['L','M','H'])
axes[1,0].set(title='Gender VS Discussion')

## PlaceofBirth
axes[1,1]=sns.countplot(x='PlaceofBirth', data=df ,ax=axes[1,1],order=df['PlaceofBirth'].value_counts()[:5].index.tolist(), hue='Class', hue_order=['L','M','H'])
axes[1,1].set(title='PlaceofBirth')

## StudentAbsenceDays
axes[2,0] = sns.histplot(x='StudentAbsenceDays' , data=df , ax=axes[2,0], hue='Class' , hue_order=['L','M','H'], multiple='dodge',bins=25)
axes[2,0].set(title='StudentAbsenceDays')

## ParentschoolSatisfaction
axes[2,1]=sns.histplot(x='ParentschoolSatisfaction' , data=df , ax=axes[2,1] , hue='Class' , hue_order=['L','M','H'], multiple='dodge',bins=25)
axes[2,1].set(title='ParentschoolSatisfaction')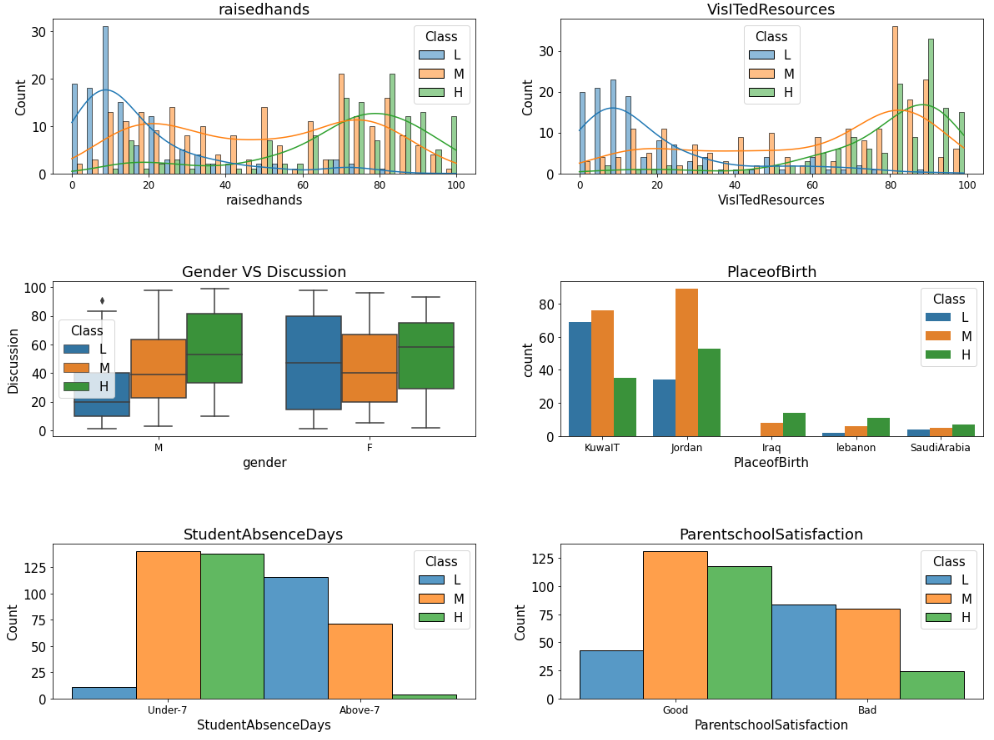
2) 범주형 변수를 수치로 바꾸어 표시하기
--> 여기서 예측하는 Target인 Class는 'L', 'M' , 'H' 을 갖는 값이며, 이를 수치형으로 변경하면 boxplot이나 그륩의 평균 / 합계 등 수치적으로 표현되는 값으로 표현이 가능하다.
# L, M, H를 숫자로 바꾸어 표현하기 (eg. L: -1, M: 0, H:1)

def to_number(val):
  if val=='L':
    return -1
  elif val=='M':
    return 0
  elif val=='H':
    return 1


df['Class_value'] = df['Class'].map(to_number)

# df['Class_value'] = df['Class'].map({
#     'L':-1,
#     'M':0,
#     'H':1
# })
# 숫자로 바꾼 Class_value 컬럼을 이용해 다양한 시각화 수행하기
mpl.rc('font',size=15)
mpl.rc('xtick',labelsize=13)
fig, axes = plt.subplots(nrows=3, ncols=2)
plt.subplots_adjust(hspace=0.5, wspace=0.3)
fig.set_size_inches(20,15)
## gender
sns.boxplot(x='gender' , y='Class_value', data=df, ax=axes[0,0]).set(title='gender')
##NationalITy
sns.boxplot(x='NationalITy', y='Class_value',data=df , ax=axes[0,1], order=df['NationalITy'].value_counts()[:7].index.to_list()).set(title='NationalITy')
## StageID
sns.boxplot(x='GradeID', y='Class_value',data=df , ax=axes[1,0], order=df['GradeID'].value_counts()[:7].index.to_list()).set(title='GradeID')
## Topic
sns.boxplot(x='Topic', y='Class_value',data=df , ax=axes[1,1], order=df['Topic'].value_counts()[:7].index.to_list()).set(title='Topic')
## StageID
sns.boxplot(x='Semester', y='Class_value',data=df , ax=axes[2,0], order=df['Semester'].value_counts()[:7].index.to_list()).set(title='Semester')
## Relation
sns.boxplot(x='Relation', y='Class_value',data=df , ax=axes[2,1], order=df['Relation'].value_counts()[:7].index.to_list()).set(title='Relation')
## 데이터 전처리 수행
## 범주형 데이터의 전처리
--> sklearn의 OneHotEncoder를 사용함.
df.columns.to_list()
## sklearn의 OneHotEncoer 사용시에는 아래의 2가지를 기억하여 사용해야 함.
1. 판다스의 시리즈가 아닌 numpy 행렬을 입력해야함 → values 이용
--> ohe=OneHotEncoder(sparse=False)
2. 벡터 입력을 허용하지 않음 → reshape을 이용해 Matrix로 변환 필요
--> X_cat_ohe = ohe.fit_transform(df[x_cat].values.reshape(-1,len(x_cat)))
위의 2가지를 통해서 array를 생성한 후 다시 dataFrame 형태로 변경 후 합쳐줌.
Feature가 여러개일 경우 ohe.get_feature_names() 안에 들어있는 이름을 사용함.
## Target 값 먼저 만들어줌
y = df['Class']


from sklearn.preprocessing import OneHotEncoder


## 범주형 데이터만 뽑음
x_cat=[
      'gender',
      'NationalITy',
      'PlaceofBirth',
      'StageID',
      'GradeID',
      'SectionID',
      'Topic',
      'Semester',
      'Relation',
      'ParentAnsweringSurvey',
      'ParentschoolSatisfaction',
      'StudentAbsenceDays',
 ]

# sparse True 시 matrix 반환 // FALSE 시 array 반환
ohe=OneHotEncoder(sparse=False)

## 1. 판다스의 시리즈가 아닌 numpy 행렬을 입력해야함 → values 이용
## 2. 벡터 입력을 허용하지 않음 → reshape을 이용해 Matrix로 변환 필요
## 아래와 같이 입력값 변경 필요함.

print(f"변경 전 shape : {df[x_cat].shape}")
X_cat_ohe = ohe.fit_transform(df[x_cat].values.reshape(-1,len(x_cat)))
print(f"변경 후 shape : {X_cat_ohe.shape}")

## 다시 데이터프레임 형태로 변경해야함.
## 카테고리 이름은 ohe.categories_ 안에 들어있음.
#  one-hot encoding 이 한개일 경우 ohe.categories_[0] 사용함
# 여러개 일 경우  feature_labels = ohe.get_feature_names()

feature_labels = ohe.get_feature_names()
X_cat_ohe_df = pd.DataFrame(X_cat_ohe , columns=feature_labels)

## 앞에있는 cat 변수들 삭제 후 one-hot-encoding 한 dataFrame 추가
df=df.drop(columns=x_cat , axis=1)
## class 도 drop
df=df.drop(columns=['Class','Class_value'],axis=1)

X = pd.concat([df,X_cat_ohe_df] , axis=1)

print(f"최종 완료 후 X : {X.shape}")
print(f"y값 : {y.shape}")
### 학습
from sklearn.model_selection import train_test_split

# train_test_split() 함수로 학습 데이터와 테스트 데이터 분리하기
X_train, X_test, y_train, y_test = train_test_split(X,y, test_size=0.2 , random_state=120)
print("X_train",X_train.shape)
print("X_test",X_test.shape)
print("y_train",y_train.shape)
print("y_test",y_test.shape)
## LogisticRegression
from sklearn.linear_model import LogisticRegression
from sklearn.metrics import classification_report , accuracy_score

# LogisticRegression 모델 생성/학습
model_lr = LogisticRegression()
model_lr.fit(X_train,y_train)

# Predict를 수행하고 classification_report() 결과 출력하기
pred = model_lr.predict(X_test)
print(classification_report(y_test, pred))
print("acc",accuracy_score(y_test,pred))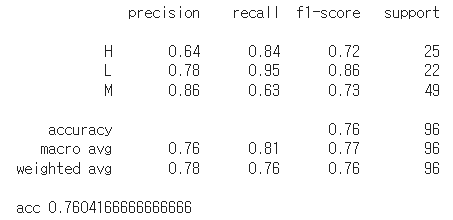
## 모델계수로 상관성 파악하기
--> Logistic Regression은 coef_를 확인하여 각 class 별 확률이 얼마나 되는 지 확인할 수 있음.
## classes_ 를 통해서 어떤 클래스 순서로 되어있는지 확인함
model_lr.classes_
[0] = 'H' , [1] = 'L' , [2] ='M' 의 순서로 class의 확률이 coef_에 저장되어있음
model_lr.coef_.shape
각 확률을 가지고 DataFrame을 만듦
fig , ax=plt.subplots()
fig.set_size_inches(10,7)

## data Frame H 일 확률  model_lr.coef_[0]
## data Frame L 일 확률  model_lr.coef_[1]
## data Frame M 일 확률  model_lr.coef_[2]

df_high= pd.DataFrame(model_lr.coef_[0].reshape(-1,1) , index=X.columns , columns=['H'])
df_middle= pd.DataFrame(model_lr.coef_[2].reshape(-1,1) , index=X.columns, columns=['M'])
df_low= pd.DataFrame(model_lr.coef_[1].reshape(-1,1) , index=X.columns, columns=['L'])

df_all = pd.concat([df_high,df_middle,df_low] , axis=1)
df_all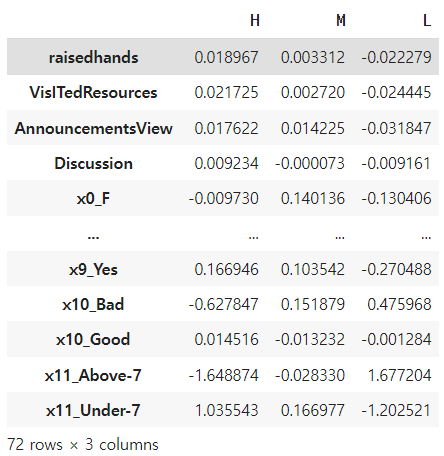
Hight를 기준으로 sort_values를 하여 상위 5가지 인자를 확인함
## High로 sort_values
df_all= df_all.sort_values(by='H',ascending=False)
df_all

## 순위 5개만 뽑음

# x_cat=[
#       'gender',
#       'NationalITy',
#       'PlaceofBirth',
#       'StageID',
#       'GradeID',
#       'SectionID',
#       'Topic',
#       'Semester',
#       'Relation',
#       'ParentAnsweringSurvey',
#       'ParentschoolSatisfaction',
#       'StudentAbsenceDays',
#  ]


## 위의 각각의 의미는 x_cat[0]이 gender이므로  x0_F / x0_M 을 의미함
## x_cat[1]이 StudentAbsenceDays 이므로 X11_under 7 / X11_above-7

## 결국 가장 중요한 것은 결석이 7일 보다 적어야 되는 feature
sns.barplot(x=df_all.index , y='H', data=df_all , order=df_all.index[:5].to_list()).set(title='Feature important for High by RL')
## XGBoost
from xgboost import XGBClassifier
from sklearn.metrics import classification_report

# XGBClassifier 모델 생성/학습
model_xgb = XGBClassifier()
model_xgb.fit(X_train,y_train)

# Predict를 수행하고 classification_report() 결과 출력하기
pred = model_xgb.predict(X_test)
print(classification_report(y_test,pred))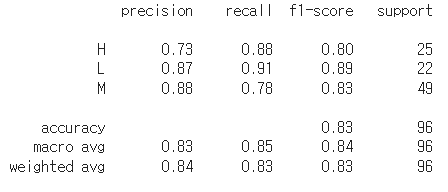
# XGBoost 모델의 feature_importances_ 속성을 plot하기

df_xgb = pd.DataFrame(model_xgb.feature_importances_ ,index=X.columns, columns=['Importance'])
df_xgb = df_xgb.sort_values(by='Importance', ascending=False)

fig, ax=plt.subplots()
fig.set_size_inches(11,7)

ax=sns.barplot(x=df_xgb.index , y='Importance' , data=df_xgb , order=df_xgb.index[:7], ax=ax)
ax.set(title='Feature important for High by XGB')
ax.tick_params(axis='x' , labelrotation=45)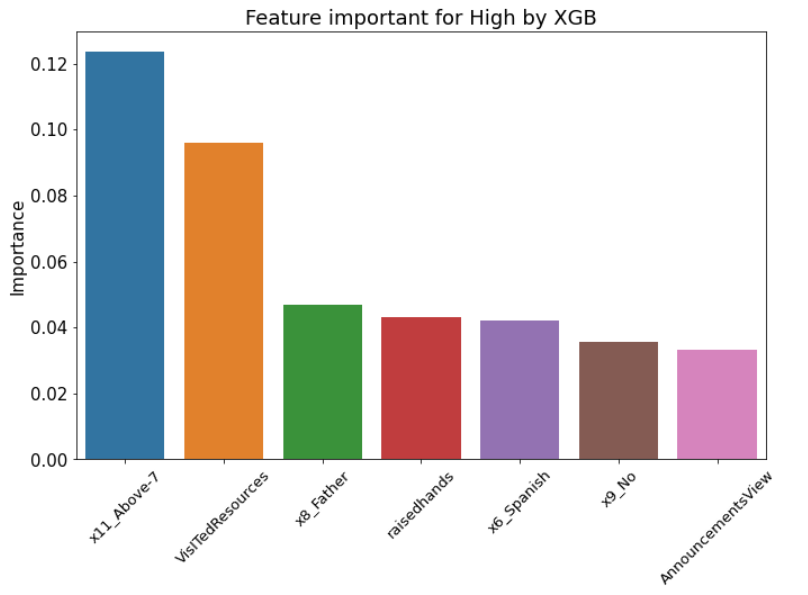
'Python 데이터분석' 카테고리의 다른 글
| [데이터 분석 시 유용한 기능 정리] - 필요부분 검색 (1) | 2023.12.06 |
|---|---|
| [데이터분석실습][이진분류_LR/XGB]Heart Failure Prediction_kaggle (0) | 2022.08.13 |
| [데이터분석실습][데이터전처리]스타벅스 고객 데이터 분석하기 (0) | 2022.08.06 |
| [데이터분석 실습][데이터전처리]구글플레이스토어 데이터 분석 (1) | 2022.07.29 |
| [데이터 분석실습]타이타닉 데이터 (0) | 2022.07.23 |


