| 일 | 월 | 화 | 수 | 목 | 금 | 토 |
|---|---|---|---|---|---|---|
| 1 | 2 | 3 | 4 | 5 | 6 | |
| 7 | 8 | 9 | 10 | 11 | 12 | 13 |
| 14 | 15 | 16 | 17 | 18 | 19 | 20 |
| 21 | 22 | 23 | 24 | 25 | 26 | 27 |
| 28 | 29 | 30 | 31 |
- 사이드프로젝트
- Ros
- 리액트네이티브
- 카트폴
- redux
- 앱개발
- 전국국밥
- Instagrame clone
- 머신러닝
- JavaScript
- kaggle
- 강화학습 기초
- React
- 조코딩
- expo
- 데이터분석
- FirebaseV9
- GYM
- python
- 딥러닝
- ReactNative
- 클론코딩
- selenium
- Reinforcement Learning
- 강화학습
- coding
- App
- pandas
- TeachagleMachine
- clone coding
- Today
- Total
qcoding
[CNN 피처추출] 거리기반 유사 이미지 추천하기 (Flow Recognition data) 본문
https://www.kaggle.com/datasets/alxmamaev/flowers-recognition
Flowers Recognition
This dataset contains labeled 4242 images of flowers.
www.kaggle.com
## 이번 실습은 CNN으로 이미지의 Feature 추출 한 후 제시된 이미지와 비슷한 특징을 갖는 이미지를 dataset에서 불러오는 실습을 진행하려고 한다.
이번 실습을 이해하기 위하여 간략히 내용을 정리한뒤 본격적으로 실습을 진행해보려고 한다.
1) 실습에 필요한 내용을 간략히 정리하기
2) VGG16 의 Convolution layer를 이용한 추출 모델 생성 후 추출된 모델을 바탕으로 가지고 있는 모든 data set을 거리기반 (norm)으로 변환
3) 제시된 이미지를 가지고 유사한 이미지 추천
1) 실습에 필요한 내용을 간략히 정리하기
1-1) Featrue 추출하기
-> 이미 학습된 vgg16 모델에서 convolution layer 까지를 사용하면 이미지의 특징이 추출된다. flatten layer와 fully connectec layer를 통해서 분류를 진행하는 데, 이 때 분류에 사용되는 feature vector를 이용하여 각 이미지별로 추출된 특징의 유사도를 비교하는 것이 이번 실습의 핵심이다.

vgg16의 layer를 살펴보면 아래의 fc1 까지 추출된 feature vector를 사용하는 것이다.
from tensorflow.keras.applications.vgg16 import VGG16, preprocess_input

base_model_ = VGG16(weights='imagenet')

layers = [(layer, layer.name, layer.trainable) for layer in base_model_.layers]
pd.DataFrame(layers, columns=['Layer Type', 'Layer Name', 'Layer Trainable'])
1-2) 유사도 측정 ( 거리 L2 norm )
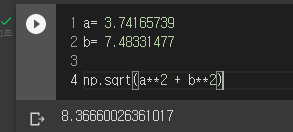
--> 유사도 측정은 거리기반으로 원점에서의 vector의 요소의 거리를 측정하여 나타낼 수 있다. 이를 L2 norm 이라 하며 , 원점에서의 유클리디안 거리를 의미힌다. numpy를 통해 계산할 수 있으며 간략히 예시를 들면 아래와 같다.

### 추출된 각 이미지의 feature vector를 list에 넣음
features=[]

## a 이미지의 추출된 vector
fea_a = [0,1,2,3]
## b 이미지의 추출된 vector
fea_b = [0,2,4,6]

features.append(fea_a)
features.append(fea_b)


### 내가 선택한 이미지의 추출된 vector
que = [0 , 0 , 0 , 0 ]

features = np.array(features)
que = np.array(que)

print(features.shape , que.shape)
위에서 이미지 a, b에서 추출된 vector를 각각 que와 비교하여 거리를 구할 수 있다. 편히상 선택한 이미지의 vector가 모든 값을 0으로 설정하였다.
### 이미지 a / b 각각 que와 거리를 계산
np.linalg.norm(features - que, axis=1)
만일 axis=1을 하지 않을 경우에는 위에서 나온 각 이미지에서 que까지의 거리를 다시 norm 계산하여 각각이 이미지가 아닌 모든 이미지 set과의 거리를 나타내게 되므로 axis=1을 사용해야 한다.
## axis=1을 하지 않을 경우 각각 이미지까지의 거리를 다시 norm 계산
np.linalg.norm(features - que)

위에서 구한 각각의 이미지까지의 거리를 순서대로 나열해서 해당하는 index를 불러오면 우리가 원하는 유사한 이미지를 추천할 수 있다.
2) VGG16 의 Convolution layer를 이용한 추출 모델 생성 후 추출된 모델을 바탕으로 가지고 있는 모든 data set을 거리기반 (norm)으로 변환
--> kaggle에서 데이터 셋을 저장한 후 학습에 사용하기 위하여 구글 드라이브에 연동 후 colab으로 불러온다
from google.colab import drive
drive.mount('/content/drive')

### kaggle에서 다운 받은 후 압축 폴더를 구글드라이브에 업로드한 주소
foler_path ='/content/drive/MyDrive/Project/flower_recommend'

try:
     os.makedirs(foler_path)
except:
  pass

os.chdir(foler_path)
try:
    os.makedirs('dataset')
except:
    pass
## 구글 드라이브에 압축 해제
## '/content/drive/MyDrive/Data_set/flower_photos.tgz' 는 압축파일 있는 경로이며
## './dataset'의 경로는 위에서 만든 /content/drive/MyDrive/Project/flower_recommend/dataset 임
ts = time.time()
!tar -xvzf '/content/drive/MyDrive/Data_set/flower_photos.tgz' -C './dataset'
te = time.time()
print("time : ", int((te - ts) / 60), " min.")폴더 구조를 보면 아래와 같이 5가지의 종류의 꽃이 분류되어 있는 것을 볼 수 있다. 이미지 전체를 배열로 불러온다.

--> 여기서 width , height의 경우 기존에 존재하는 vgg16 모델을 사용하므로 vgg16 모델 학습시에 사용한 이미지 사이즈인 224 x 224 를 동일하게 사용해야 한다.
## Train 이미지 불러오

train_file_path = './dataset/flower_photos'


train_image_data = []

total_classes = 5
height = 224   ## 이미지 사이즈 중요함
width = 224    ##
channels = 3


### image 파일 주소
images_folers = os.listdir(train_file_path)

for foler in images_folers:
    print("foler process")
    path = train_file_path + "/" + foler

    if foler != 'LICENSE.txt':
      images = os.listdir(path)

      for img in images:
          try:
              image = cv2.imread(path + '/' + img)
              image_fromarray = Image.fromarray(image,'RGB')
              resize_image = image_fromarray.resize((height,width))
              # scaled_resize_image=preprocess_input(resize_image)
              train_image_data.append(np.array(resize_image))
          except:
              print("Error - loading")

# # list --> array
train_image_data = np.array(train_image_data)
train_image_data.shape
배열을 만들면 총 3670 이미지가 있는 것을 확인할 수 있다.
### 이미지 시각화
이미지를 시각화해보면 폴더의 순서가 daisy가 먼저 있으므로 앞에서 10개 이미지는 모두 daisy 꽃만 있는 것을 알 수 있다. 학습을 진행하려면 해당 순서를 랜덤으로 섞어 주어야 할 것 같지만 여기서는 feature 추출이 목표이므로 굳이 섞지 않아도 된다.
만일 섞을 경우 아래의 코드를 이용하면 된다.
## 데이터 셔플
shuffle_index = np.arange(train_image_data.shape[0])
np.random.shuffle(shuffle_index)

### 셔플 시에 label encoding 된 이미지를 사용함

train_image_data = train_image_data[shuffle_index]
## 이미지 시각화
n = 10
plt.figure(figsize=(20, 2))
for i in range(n):
ax = plt.subplot(1, n, i + 1)
plt.title(f"{i}")
plt.imshow((train_image_data[i]))
plt.gray()
plt.show()
### 추출 모델 만들기
추출 모델은 vgg16을 그대로 가져온 뒤 'fc1' layer 부분을 모델의 output으로 사용한다.
def extract_model():
  base_model = VGG16(weights='imagenet')
  model =Model(inputs=base_model.input, outputs=base_model.get_layer('fc1').output)

  model.compile(loss='categorical_crossentropy',
              optimizer=tf.keras.optimizers.Adam(0.001),
              metrics=['accuracy'])

  return model
### 이미지 추출부분
기존에 가진 dataset의 feature vector를 추출하는 부분으로 l2_norm을 계산한 뒤 전체 feature를 normalize 시켜준다.
이 함수를 통하면 아래와 같은 vector를 얻을 수 있다.
def feature_extract(img,model):
  feature = model.predict(img , verbose=0)[0]
  l2_norm = np.linalg.norm(feature)

  return feature / l2_norm
## 모든 데이터 set의 feature fector를 추출함
--> 여기서 preprocess_input 의 경우 VGG16 모델을 학습할 시 사용한 scaling 방법으로 keras에서 제공하는 것을 사용하였다.
features = []

## 모델 생성
extract_model = extract_model()

## feature 저장하기
for i in range(0, len(train_image_data)):
  if i%100 == 0:
    print(f'{i}번째')
  try:
    # preprocessing 처리 후 이미지의 feature 추출함
    scaled_img = preprocess_input(train_image_data[i].reshape(-1,width,height,channels))
    feature = feature_extract(scaled_img , extract_model)

    features.append(feature)

  except Exception as e:
    print('예외가 발생했습니다.', e)
위의 코드를 실행하면 traing set에 있는 모든 이미지의 feature vector를 담은 리스트가 생성된다.

3) 제시된 이미지를 가지고 유사한 이미지 추천
from tensorflow.keras.preprocessing import image

###
## 이미지 추출하기
img_path = './rose1.png'
img_a = image.load_img(img_path, target_size=(width, height))
img_array = image.img_to_array(img_a)
plt.imshow(img_array/255)

expanded_img_array = np.expand_dims(img_array, axis=0)

### test 이미지 feature 추출하기
scaled_img = preprocess_input(expanded_img_array.reshape(-1,width,height,channels))
query = feature_extract(scaled_img , extract_model)

print(query)

## 데이터 set 과의 이미지 유사도 측정하기
dists = np.linalg.norm(features - query, axis=1)


## 상위 n 개의 거리 유사도 기반으로 나열하기
n=20
ids = np.argsort(dists)[:n]   ### 오름 차순으로 정렬
idx = ids[::-1]               ### 내림 차순으로 변경

## 선택된 index 이미지의 score를 배열로 만듦
scores = [(dists[id]) for id in ids]

print(f'best_dix : {ids[0]} , best_score : {scores[0] : .3f}')
# 이미지 시각화
plt.figure(figsize=(15,10))

for i in range(len(ids)):
    n_cols = 5
    n_rows = (len(ids) - 1) // n_cols + 1

    ax = plt.subplot(n_rows, n_cols, i + 1)
    plt.subplots_adjust(wspace=0.4, hspace=0.4)
    idx = ids[i]
    score = scores[i]

    plt.title(f"{idx}th / {100 - (score/np.max(scores) *100) : .1f}%")
    plt.imshow((train_image_data[ids[i]]))
    plt.gray()
plt.show()
위의 코드를 차례대로 살펴보면
### 임의로 제시된 이미지의 feature 추출하는 부분에서 역시 dataset 에서 적용한 방법과 동일하게 feature를 추출해준다.
img_path = './rose1.png'
img_a = image.load_img(img_path, target_size=(width, height))
img_array = image.img_to_array(img_a)
plt.imshow(img_array/255)

expanded_img_array = np.expand_dims(img_array, axis=0)

### test 이미지 feature 추출하기
scaled_img = preprocess_input(expanded_img_array.reshape(-1,width,height,channels))
query = feature_extract(scaled_img , extract_model)

print(query)
### 가지고 있는 dataset의 추출된 features 배열에 있는 각 요소와 유사도를 측정한다.
여기서 값이 크다는 것은 거리가 멀다는 것이므로 유사성이 낮다는 것이다.
## 데이터 set 과의 이미지 유사도 측정하기
dists = np.linalg.norm(features - query, axis=1)
print(dists)
### 상위 n 개의 유사도를 비교하여, argsort를 통하여 오름차순으로 정렬한다 ( l2_norm 크기가 작은 것이 거리가 가까우므로 가장 유사함) 정렬된 index를 통해서 시각화할 수 있게 idx , scores 배열을 생성한다.
## 상위 n 개의 거리 유사도 기반으로 나열하기
n=20
ids = np.argsort(dists)[:n]   ### 오름 차순으로 정렬후 index를 반환


## 선택된 index 이미지의 score를 배열로 만듦
scores = [(dists[id]) for id in ids]

print(f'best_dix : {ids[0]} , best_score : {scores[0] : .3f}')
### 이미지 시각화
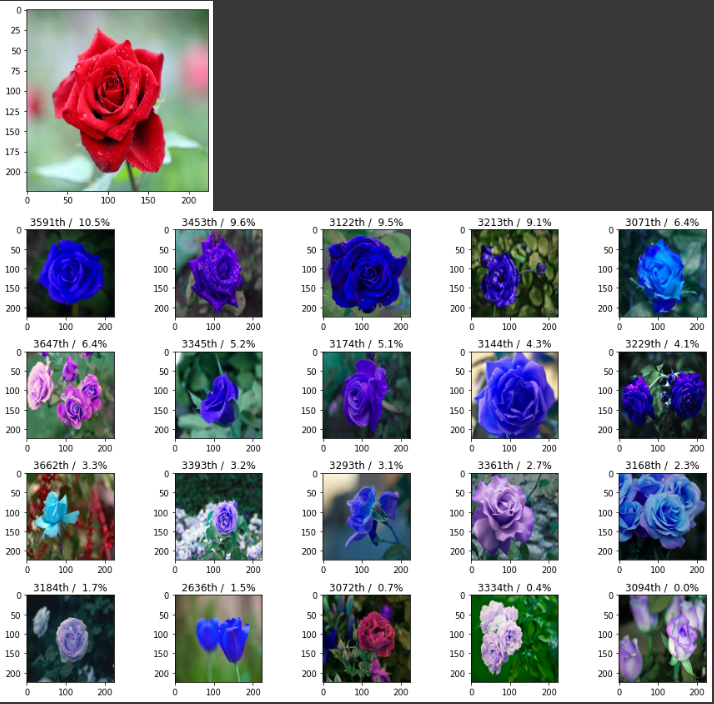
--> 각각의 이미지 index 와 score를 계산하는 데 , 값이 작을 수록 유사도가 높은 것이므로 100에서 빼주어서 대략적으로 정규화하여 (%)로 나타내었다.
# 이미지 시각화
plt.figure(figsize=(15,10))

for i in range(len(ids)):
    n_cols = 5
    n_rows = (len(ids) - 1) // n_cols + 1

    ax = plt.subplot(n_rows, n_cols, i + 1)
    plt.subplots_adjust(wspace=0.4, hspace=0.4)
    idx = ids[i]
    score = scores[i]

    plt.title(f"{idx}th / {100 - (score/np.max(scores) *100) : .1f}%")
    plt.imshow((train_image_data[ids[i]]))
    plt.gray()
plt.show()
위에서 튤립을 추천할 경우 가장 유사한 이미지로 아래의 사진이 추천되었다. 기본적으로 보면 모양의 형태가 매우 유사한 것을 볼 수 있다.

'머신러닝 딥러닝' 카테고리의 다른 글
| [강화학습]정책기반 강화학습_Policy Gradient_Reinforce_Cartpole (0) | 2023.02.05 |
|---|---|
| [강화학습]Dqn_Mountain car_강화학습 예제 (1) | 2023.01.29 |
| [강화학습]Cartpole(카트폴) Deep Q-learning (Dqn) 실습 (0) | 2023.01.14 |
| [CNN]CAM (Class Activation Map) (1) | 2023.01.06 |
| [VGG16 전이학습] 강아지 고양이 분류 (0) | 2022.12.27 |


