| 일 | 월 | 화 | 수 | 목 | 금 | 토 |
|---|---|---|---|---|---|---|
| 1 | ||||||
| 2 | 3 | 4 | 5 | 6 | 7 | 8 |
| 9 | 10 | 11 | 12 | 13 | 14 | 15 |
| 16 | 17 | 18 | 19 | 20 | 21 | 22 |
| 23 | 24 | 25 | 26 | 27 | 28 | 29 |
| 30 |
- 전국국밥
- 데이터분석
- coding
- 클론코딩
- 앱개발
- expo
- pandas
- 리액트네이티브
- GYM
- 카트폴
- FirebaseV9
- 딥러닝
- ReactNative
- 강화학습
- TeachagleMachine
- kaggle
- clone coding
- Ros
- redux
- App
- JavaScript
- selenium
- 머신러닝
- python
- 사이드프로젝트
- 조코딩
- React
- Instagrame clone
- Reinforcement Learning
- 강화학습 기초
- Today
- Total
qcoding
[CNN]CAM (Class Activation Map) 본문
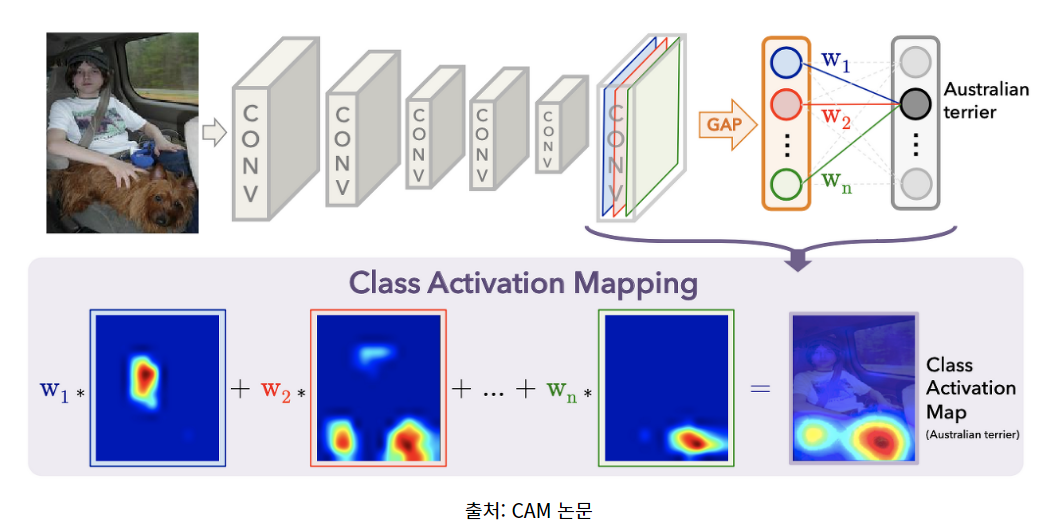
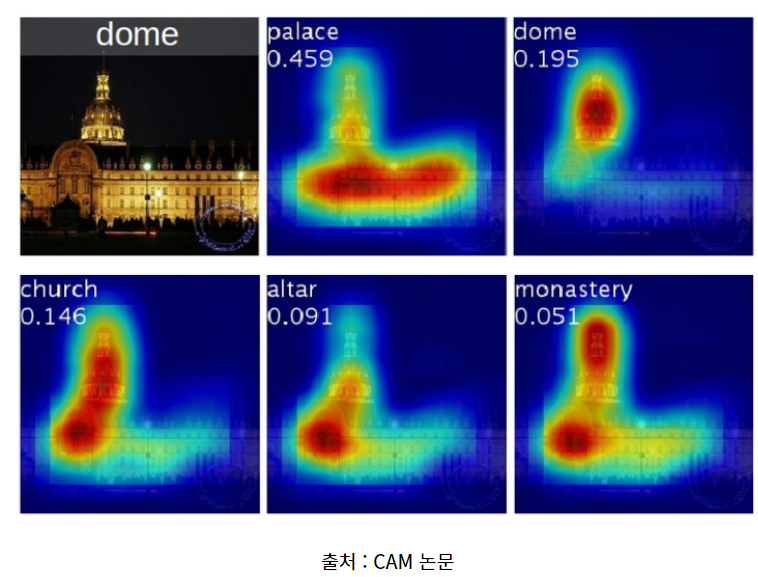
** 이번실습은 CNN을 활용한 Class Activation Map을 만들어 보는 실습이다. CAM은 CNN으로 분류 문제를 풀 때 이미지에서 어떤 feature가 예측에 영향을 주는 지 시각화할 수 있는 방법이다.
기존에 CNN 활용 시 Feature 추출 후 예측을 위해 Fully connected layer 부분 대신 Global Avg 풀링으로 Convolution layer 부분에서 추출한 feature map과 마지막 예측에 사용된 weight를 곱해서 이미지를 시각화 하는 것이다.
실습은 크게 아래와 같은 순서로 진행된다.
1) 데이터 셋팅 ( 강아지 고양이 데이터 set을 사용한다.)
2) CNN 모델 생성 (VGG16 전이학습 사용)
3) Class Activation Map 생성
1) 데이터 셋팅
2022.12.27 - [머신러닝 딥러닝] - [VGG16 전이학습] 강아지 고양이 분류
[VGG16 전이학습] 강아지 고양이 분류
https://www.kaggle.com/datasets/tongpython/cat-and-dog Cat and Dog Cats and Dogs dataset to train a DL model www.kaggle.com ## 이미지 분류의 대표적인 강아지 / 고양이 분류 문제를 VGG16의 전이학습을 통해서 구현해보는 실습
qcoding.tistory.com
데이터 셋팅과 전처리 부분은 위에 링크된 강아지 고양이 분류글과 동일하게 진행된다. 또한 CNN 모델의 전이학습 또한 동일하므로 이전의 결과를 사용해도 실습에는 문제가 되지 않는다.
import tensorflow as tf
from tensorflow import keras
from tensorflow.keras.preprocessing.image import ImageDataGenerator, load_img, img_to_array, array_to_img
from tensorflow.keras.preprocessing import image
from tensorflow.keras.models import Model
from tensorflow.keras.layers import Input, Flatten, Dense, GlobalAveragePooling2D
from tensorflow.keras.applications.vgg16 import VGG16, preprocess_input

import math
import time
import os
import pathlib
from PIL import Image
import cv2
import scipy as sp

import pandas as pd
import numpy as np
import matplotlib as mpl
import matplotlib.pyplot as plt
import seaborn as sns

from google.colab import drive
drive.mount('/content/drive')

import time
import os

foler_path ='/content/drive/MyDrive/Project/cat_and_dog'

try:
     os.makedirs(foler_path)
except:
  pass

os.chdir(foler_path)
try:
    os.makedirs('dataset')
except:
    pass

# # # 구글 드라이브에 압축 해제
ts = time.time()
!unzip -q '/content/drive/MyDrive/Data_set/archive.zip' -d './dataset'
te = time.time()

print("time : ", int((te - ts) / 60), " min.")
### 이미지를 받아와서 array로 변환함
## Train 이미지 불러오기
train_file_path = './dataset/training_set/training_set'


train_image_data = []
train_image_labels = []
total_classes = 2
height = 224   ## 이미지 사이즈 중요함
width = 224    ##
channels = 3


### image 파일 주소
images_files = os.listdir(train_file_path)

for file in images_files:

    path = train_file_path + "/" + file

    images = os.listdir(path)

    for img in images:
        try:
            image = cv2.imread(path + '/' + img)
            image_fromarray = Image.fromarray(image,'RGB')
            resize_image = image_fromarray.resize((height,width))
            train_image_data.append(np.array(resize_image))
            label =img.split('.')[0]
            train_image_labels.append(label)
        except:
            print("Error - loading")

# # list --> array
train_image_data = np.array(train_image_data)
train_image_labels = np.array(train_image_labels)

### Test 이미지 불러오기
### image date 만들기
# os.chdir('../')

## Test 이미지 불러오기
test_file_path = './dataset/test_set/test_set'


test_image_data = []
test_image_labels = []
total_classes = total_classes
height = height
width = width
channels = channels


### image 파일 주소
images_files = os.listdir(test_file_path)

for file in images_files:

    path = test_file_path + "/" + file

    images = os.listdir(path)

    for img in images:

        try:
            image = cv2.imread(path + '/' + img)
            image_fromarray = Image.fromarray(image,'RGB')
            resize_image = image_fromarray.resize((height,width))
            test_image_data.append(np.array(resize_image))
            label =img.split('.')[0]
            test_image_labels.append(label)
        except:
            print("Error - loading")

# # # list --> array
test_image_data = np.array(test_image_data)
test_image_labels = np.array(test_image_labels)
## 데이터 확인
train_image_data.shape , train_image_labels.shape , test_image_data.shape , test_image_labels.shape
저번 글과 좀 다른 것이 있다면 이번에는 학습시 sparse_crossentropy 를 사용하여 one-hot-encoding 대신 labelEncoder만 사용한 것이다.
from sklearn.preprocessing import LabelEncoder

le = LabelEncoder()

train_image_labels_enc = le.fit_transform(train_image_labels)
test_image_labels_enc = le.transform(test_image_labels)
X_train , X_valid , y_train , y_valid = train_test_split(train_image_data , train_image_labels_enc , test_size=0.1, random_state=100)
X_train.shape , X_valid.shape , y_train.shape , y_valid.shape
2) CNN 모델 생성 (VGG16 전이학습 사용)
### 아래 부분은 model을 생성하는 부분으로 위에 사진에서 본 Global AVG pooling 을 사용하여 모델을 생성한다.
def build_model():
    base_model = tf.keras.applications.VGG16(input_shape= (width, height, channels),
                                             weights='imagenet',
                                             include_top=False)

    # add a GAP layer
    output = tf.keras.layers.GlobalAveragePooling2D()(base_model.output)

    # output has two neurons for the 2 classes(dogs and cats)
    output = tf.keras.layers.Dense(total_classes, activation='softmax')(output)

    # set the inputs and outputs of the model
    model = tf.keras.models.Model(base_model.input, output)

    for layer in base_model.layers[:-4]:
        layer.trainable = False

    model.compile(optimizer=tf.keras.optimizers.RMSprop(0.001),
                  loss='sparse_categorical_crossentropy',
                  metrics=['accuracy'])
    model.summary()

    return model

model = build_model()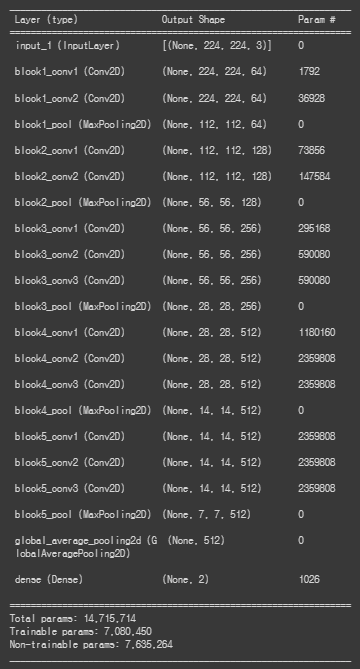
위의 summary에서 중요한 layer은 2가지이다.
1) weight를 담고 있는 layer
--> 맨 마지막 dense(Dense) layer의 weights가 위의 그림의 w1, w2, w3 ... 이 된다.
2) feature 추출된 정보를 담고 있는 layer
--> Global AVG 풀링 layer를 지난 이미지의 feature 정보 , 위의 summary에서는 block5_pool (MaxPooling2D)의 output (7,7,512)의 결과가 필요하다.
### 모델 학습 및 시각화
### 모델 학습
epochs= 100
batch_size = 32


## early stop   // model checkpoint
early_stopping = keras.callbacks.EarlyStopping(monitor='val_loss', patience=2)
model_checkpoint = keras.callbacks.ModelCheckpoint(
    filepath='./vgg16/best_weights.h5',
    monitor='val_loss',
    save_best_only = True,
    verbose = 1
)
history= model.fit(train_generator, steps_per_epoch=len(X_train)//batch_size, epochs=100,
                              validation_data=val_generator, validation_steps=len(X_valid)//batch_size, verbose=1,callbacks=[early_stopping,model_checkpoint] )
### 시각화
### 시각화 하기
f, (ax1, ax2) = plt.subplots(1, 2, figsize=(12, 4))
t = f.suptitle('vgg16  & Image Augmentation Performance', fontsize=12)
f.subplots_adjust(top=0.85, wspace=0.3)

epoch_list = list(range(1, len(history.history['loss'])+1))

ax1.plot(epoch_list, history.history['accuracy'], label='Train Accuracy')
ax1.plot(epoch_list, history.history['val_accuracy'], label='Validation Accuracy')
ax1.set_xticks(np.arange(0, len(history.history['loss'])+1, 1))
ax1.set_ylabel('Accuracy Value')
ax1.set_xlabel('Epoch')
ax1.set_title('Accuracy')
ax1.set_yticks([0.5,0.6,0.7,0.8,0.9,0.95,1.0])
ax1.grid()
l1 = ax1.legend(loc="best")

ax2.plot(epoch_list, history.history['loss'], label='Train Loss')
ax2.plot(epoch_list, history.history['val_loss'], label='Validation Loss')
ax2.set_xticks(np.arange(0, len(history.history['loss'])+1, 1))
ax2.set_ylabel('Loss Value')
ax2.set_xlabel('Epoch')
ax2.set_title('Loss')
l2 = ax2.legend(loc="best")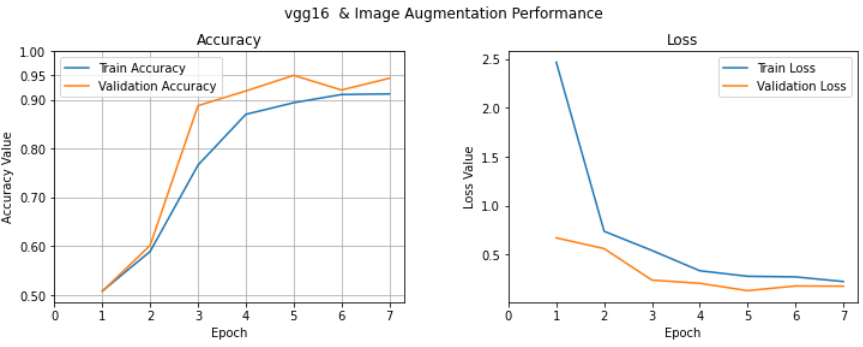
validation set으로 95%의 높은 분류성능을 가진 것을 확인할 수 있다.
3) Class Activation Map 생성
--> 여기서는 위에서 생성한 CNN모델에서 layer 정보를 가져와서 CAM을 생성하기 위한 cam_model을 정의한다. 기본적으로 CNN모델의 INPUT은 동일하고 OUT으로는 Global AVG 풀링 layer와 CNN 맨마지막 layer의 output 정보를 가지고 생성한다.
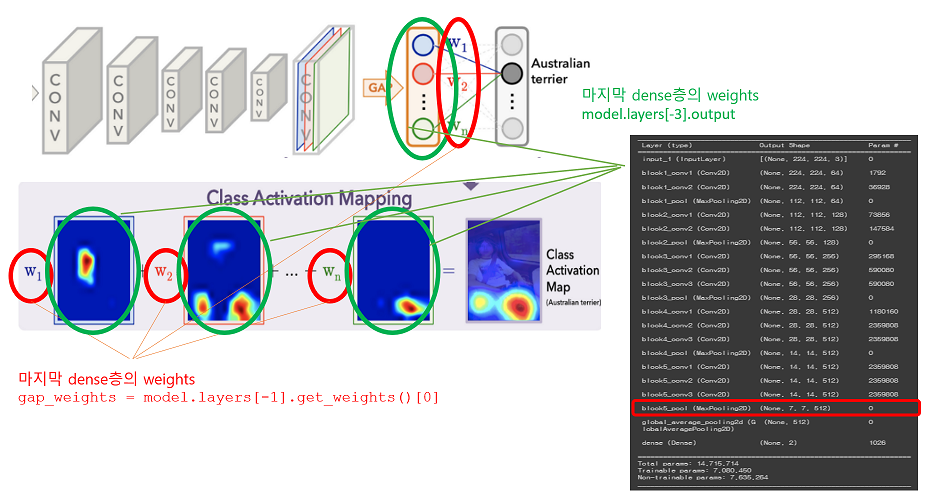
마지막 conv layer feature map = (7,7,512) --> GAP를 통해 (512,) 최종 OUPUT은 dense가 2 이므로 (512,2) shape을 가지며, 위에서 w1 , w2 weight가 의미하는 값이 아래의 맨 마지막 layer (dense층) 의 weight 값을 의미한다.
cam_model = tf.keras.models.Model(inputs=[model.input], outputs=[model.layers[-3].output, model.layers[-1].output])
cam_model.summary()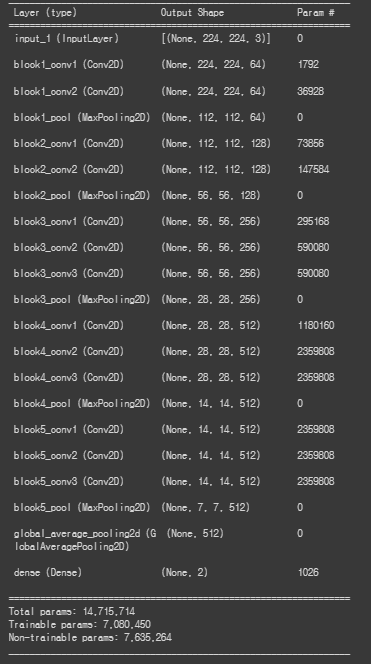
### dense의 weight
gap_weights = model.layers[-1].get_weights()[0]
print(gap_weights)
print(gap_weights.shape)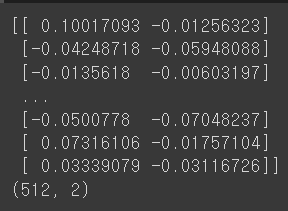
위의 gap_weights가 w1,w2 ... 를 의미한다. shape의 (512,2)를 보면 CNN의 CONV layer의 마지막이 (7, 7, 512)로 feature map이 512개가 생겻는데 이를 각각 GAP(global avg pooling)을 해서 512개가 나오고 강아지 고양이를 구분하는 것으로 label class가 2개이므로 마지막 dense에 연결될 때는 weights가 2개가 필요하게 된다.
#### 우선 valid set에 있는 한장의 이미지를 가지고 예측을 수행하여 진행상황을 살펴보도록 하자
### feature for img
### 위에서 만든 cam model에 이미지를 넣어서 feature_for_img를 계산함
### 여기서 output[0] --> (7,7,512) 의 feature 값이며
###       output[1] --> (1,2) 의 마지막 dense의 weight 값을 의미함
### features ( 1, 7, 7, 512) 인데 features[0]은 (7,7,512) , results (1,2) 인데 results[0]은 (2,) result는 그냥 output 결과임

features , results = cam_model.predict(np.expand_dims(X_valid[0], axis=0))
results[0]
X_valid[0] 이미지를 가지고 예측을 수행하면 results가 [1,0]의 결과가 나온 것을 볼 수 있다. 이는 cat / dog 예측에서 학습 시 LabelEncoder의 순서가 반영 된 것으로 아래 사진을 보면 cat / dog의 순서로 [1 , 0] 일 경우 cat으로 예측한 것을 확인할 수 있다.

실습에서 편의상 [w1, w2 ... wn] 은 label로 예측할 때 사용되는 weights만을 사용했다. 즉 X_valid[0]은 고양이 이므로 gap_weights 의 첫번째 열에 있는 고양이 예측에 사용한 weights만을 사용하였다.
### 한장만 가지고 예시
### X_valid[0]번은 강아지임
model.load_weights('./vgg16/best_weights.h5')

### weights 가져오기
gap_weights = model.layers[-1].get_weights()[0]
class_activation_weigths = gap_weights[:,0]   ## 고양이 label == 0


### 이미지 feature 추출과정
features , results = cam_model.predict(np.expand_dims(X_valid[0], axis=0))
class_activation_features=sp.ndimage.zoom(features[0],(224/7, 224/7, 1),order=3)

### dot
cam_output = np.dot(class_activation_features, class_activation_weigths)
print(f"cam_output shape : {cam_output.shape}")

cam_output_reshaped = tf.reshape(cam_output, (width,height))
print(f'cam_output_reshaped shape : {cam_output_reshaped.shape}')

## 이미지 그리기
## 원래 예측한 label
idx=np.argmax(results[0])
pred=le.inverse_transform(np.array(idx).reshape(-1,1).ravel())[0]
print(f"prediction : {pred}")
print(f"label : {'dog' if y_valid[0]==1 else 'cat'}")

plt.figure(figsize=(4,4))
plt.imshow(cam_output_reshaped, cmap='jet', alpha=0.5)
plt.imshow(tf.squeeze(np.expand_dims(X_valid[0], axis=0)), alpha=0.5)
plt.show()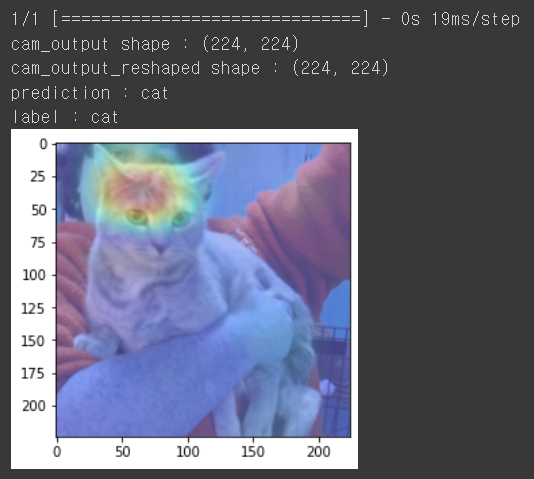
위에서 사용된 코드에서 tf.squeeze 와 scipy의 sp.ndimage.zoom를 살펴보면 아래와 같다.
1) tf.squeeze
--> squeeze는 차원 중 사이즈가 1인 것을 찾아 스칼라값으로 바꿔 해당 차원을 제거하는 것으로
사용하는 이유는 tf.squeeze는 predcit할 때 (1,244,244,3)으로 맞춰주려고 앞에 1을 차원에 추가한 것을 다시 (224,224,3)으로 바꿔주는 역활로 plt.imshow()를 사용해서 시각화 할 때 다시 차원을 줄이기 위해서 사용함.
2) sp.ndimage.zoom
--> scipy.ndimage.zoom(input, zoom, order=2, output=None, mode='wrap', prefilter=False, cval=0.1, grid_mode=True)
- input은 이미지 array가 들어가며 여기서는 cam_model로 추출한 이미지 feature가 들어감
- zoom은 위의 input 이미지에 각 axis에 곱해지는 비율을 의미함 의의 input에 들어가는 feature가 (7,7,512)인데 zoom (244/7,244/7,1)이므로 각 axis 에 곱해서 output이미지는 (224,224,1)이 됨.
- order은 보간의 방법을 의미하는 것으로 order에 따라 값이 달라짐.
위의 결과에서 보면 고양이라고 예측을 올바르게 했으며, 머리에 있는 줄무늬 부분이 예측에 많은 영향을 미쳤음을 알수 있다.
위의 과정을 함수로 만들어서 여러 사진을 예측해보면 아래와 같다.
### 여러장 하기 위해 함수 정의
def show_cam(sample_idx,image_value, features, results,idx):

    features_for_img = features[0]
    prediction = results[0]

    #### 이부분이 위에서 말하는 w1, w2 ... 을 의미함 --> label에 해당하는 즉 label로 판단할 수 있게하는 weigths 부분을 가져옴
    class_activation_weigths = gap_weights[:,idx]   ##기존의 gap_weights는 (512,2)임 .  label만 가져온 shape (512,) 이며 1차원의 값
    ### 이부분이 위에서 이미지에서 feature로 각 추출된 그림을 의미하며, 이것을 원래의 이미지와 동일하게 맞추기 위하여 확대함
    ### (7,7,512) -> (224,224,512)로 zoom함
    class_activation_features = sp.ndimage.zoom(features_for_img, (width/7, height/7, 1), order=2)
    cam_output = np.dot(class_activation_features, class_activation_weigths)
    cam_output = tf.reshape(cam_output, (width,height))

    # visualize the results
    print(f"sample : {sample_idx}th")
    print(f"ground label: {'dog' if y_test[sample_idx]==1 else 'cat'}")
    print(f"prediction: {'dog' if tf.argmax(results[0]) else 'cat'}")
    plt.figure(figsize=(4,4))
    plt.imshow(cam_output, cmap='jet', alpha=0.5)

    plt.imshow(tf.squeeze(image_value), alpha=0.5)
    plt.show()
### TEST 데이터 SET 준비
### TEST 이미지로 여러장 예측
## label
print(test_image_data.shape,test_image_labels_enc.shape)

y_test = test_image_labels_enc

## test data
test_datagen = ImageDataGenerator(
                                  rescale=1./255,
                                )

test_generator = test_datagen.flow(test_image_data, y_test, batch_size=20)
tf.print(test_generator)
### 예측하기
-> random으로 3장의 이미지를 선택해서 예측하는 코드는 아래와 같다.
## 예측하기
n = 3
test_samples=test_image_data.shape[0]

## model weight 가져오기
model.load_weights('./vgg16/best_weights.h5')

plt.figure(figsize=(15, 15))
plt.subplots_adjust(hspace=1.0 , wspace=0.5)
for i in range(n):
    ### 임의로 뽑은 index에서 예측 번호 계산
    sample_idx = np.random.randint(0,test_samples)
    input_image = np.expand_dims(test_image_data[sample_idx], axis=0)

    ## cam_model로 그림에서 추출한 feature와 예측한 result를 받아옴
    features , results = cam_model.predict(input_image)
    label = np.argmax(results[0])

    ### dot 계산
    show_cam(sample_idx,input_image , features, results , label)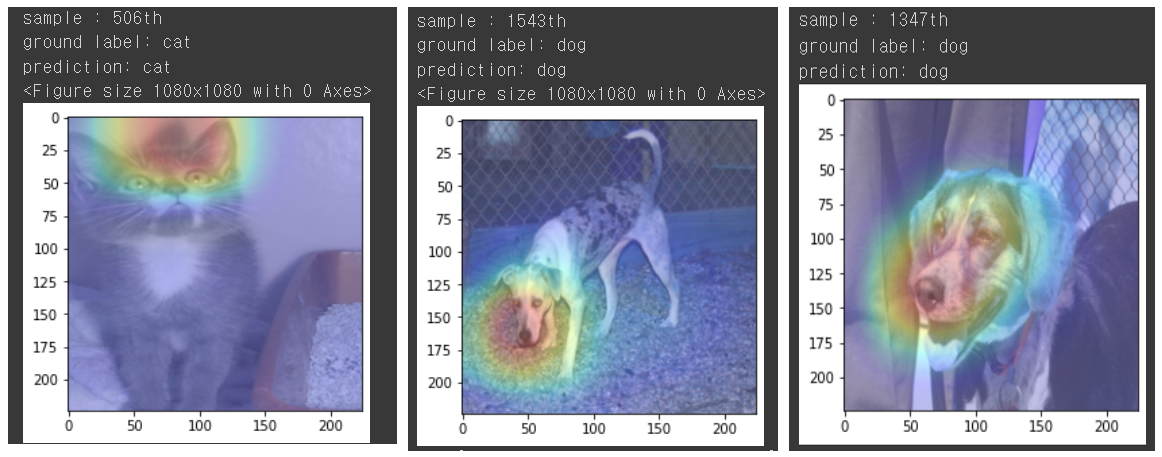
각 예측이 정확하며, 여측에서 어느 부분이 영향을 미쳣는지 시각적으로 확인할 수 있다.
'머신러닝 딥러닝' 카테고리의 다른 글
| [강화학습]정책기반 강화학습_Policy Gradient_Reinforce_Cartpole (0) | 2023.02.05 |
|---|---|
| [강화학습]Dqn_Mountain car_강화학습 예제 (1) | 2023.01.29 |
| [강화학습]Cartpole(카트폴) Deep Q-learning (Dqn) 실습 (0) | 2023.01.14 |
| [CNN 피처추출] 거리기반 유사 이미지 추천하기 (Flow Recognition data) (1) | 2022.12.27 |
| [VGG16 전이학습] 강아지 고양이 분류 (0) | 2022.12.27 |


